Beyond the Dashboard: How Metric Trees Turn Data Chaos into Strategic Clarity
It’s a scene that plays out in countless offices every quarter. A key metric, let’s say “Monthly Active Users,” suddenly drops. A wave of low-grade panic ripples through Slack. The data team scrambles to pull reports, the product team defensively points to the stability of recent feature launches, and leadership wants answers, yesterday. Everyone is staring at their dashboards, but the dashboards are just staring back, offering numbers without a narrative. Where do you even begin to look?
This is the paradox of the modern data stack: we have more data than ever before, but often, less clarity. Our dashboards are brilliant at showing us what is happening, but they fall short of explaining why. They present a collection of disconnected data points, leaving us to connect the dots under pressure. This reactive, frantic approach to data analysis is not just inefficient; it’s a significant barrier to building a truly data-driven culture.
There is, however, a more structured way. It’s a powerful framework that acts less like a dashboard and more like a strategic map for your business. It’s called a Metric Tree, and it’s designed to connect every team’s actions to a top-level goal, providing a clear, logical path for investigation and decision-making.
What Exactly Is a Metric Tree?
First, let’s clear something up. If you search for “Metric Tree,” you might find a computer science definition related to indexing data. While fascinating, that’s not what we’re talking about here. In product and business strategy, a Metric Tree is a visual, hierarchical model that deconstructs a single, high-level goal into its underlying components. It’s a living diagram that shows the mathematical and logical relationships between the metrics that run your business.
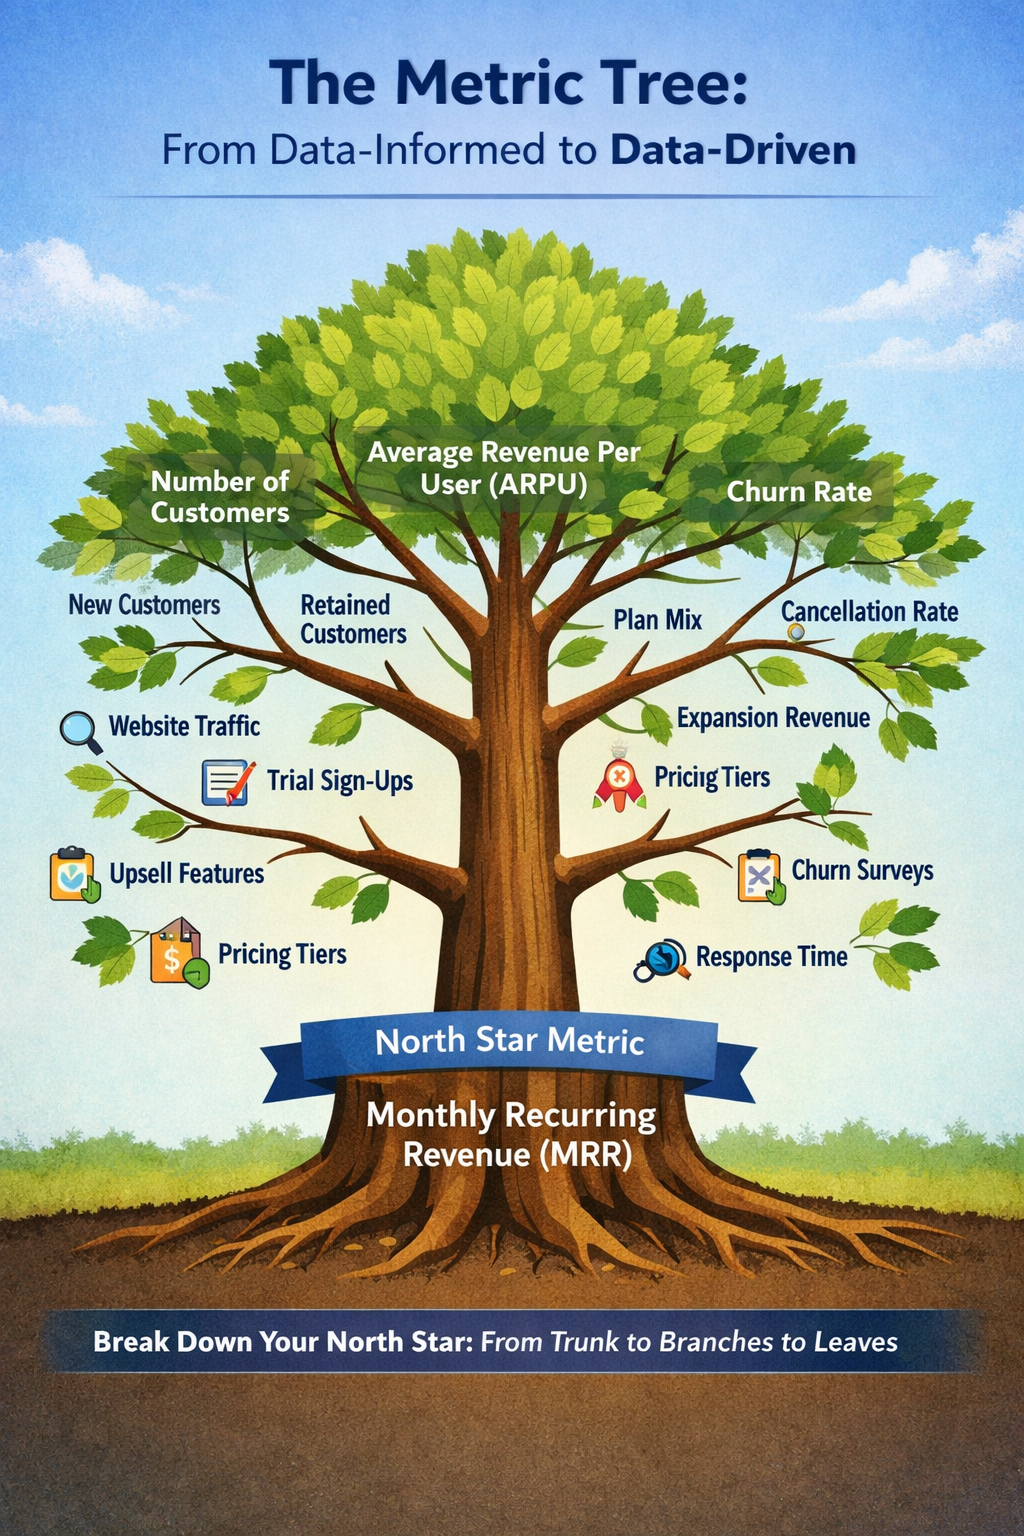
The beauty of this KPI framework lies in its intuitive anatomy. At its base is the Trunk, representing your North Star Metric—the single most important measure of success, like Monthly Recurring Revenue (MRR) or Daily Active Users (DAU). Sprouting from the trunk are the Main Branches, which are the 3-5 key drivers that directly influence the North Star. For MRR, these branches would be concepts like the total number of customers and the average revenue per customer.
Finally, you have the Smaller Branches and Leaves, which represent the actionable levers your teams can pull every day. These are the granular product metrics—like trial sign-up rates, feature adoption, or checkout conversion rates—that teams can directly control. The health of these leaves determines the strength of the branches, which in turn supports the growth of the entire trunk. It’s a complete system where every part is connected to the whole.
How to Build Your First Metric Tree: A Step-by-Step Guide
Creating a Metric Tree isn’t an abstract exercise; it’s a practical tool for building a data-driven strategy. The process begins with the most critical step: defining your North Star Metric. This metric should reflect both customer value and business success, not just vanity. Once chosen, you deconstruct it with a simple formula. For example, if your North Star is Monthly Recurring Revenue (MRR), the foundational equation is MRR = (Number of Customers) * (Average Revenue Per User). This equation forms the primary structure of your tree.
With the foundation in place, you identify the key drivers by expanding on the formula. Number of Customers, for instance, is driven by New Customers and Retained Customers, while Average Revenue Per User is driven by Plan Mix and Expansion Revenue. The next step is to connect these drivers to actionable levers—the specific activities your teams control. You ask, “What influences New Customers?” The answers—Website Visitors, Trial Sign-up Rate, Trial-to-Paid Conversion Rate—become the leaves on your tree, connecting daily work directly to high-level strategy.
The final step is to visualize and validate. Sketch the tree on a whiteboard or use a digital tool like Miro. This visual map is a collaborative artifact, not a static report. Share it with different teams and ask for feedback. Does the logic hold up? Are the connections real? A Metric Tree’s power comes from shared understanding and collective ownership, ensuring everyone is oriented toward the same goal and understands how they contribute.
Metric Trees in Action: Real-World Examples
The framework is versatile enough to adapt to any business model. For a typical B2B SaaS company, the North Star is often Monthly Recurring Revenue (MRR). Its key drivers are New MRR, Expansion MRR, and Churned MRR. The actionable levers then become tangible metrics like demo requests, trial-to-paid conversion rates, and the adoption of upsell-gated features. In contrast, an e-commerce marketplace might focus on Gross Merchandise Value (GMV) as its North Star. This would be driven by the Number of Active Buyers, Orders per Buyer, and Average Order Value (AOV), with levers like product page conversion rates and checkout abandonment rates.
The model works just as well for non-transactional businesses. Consider a media or content platform whose success depends on audience engagement. Their North Star might be Total Engaged Time. The key drivers would then be the Number of Active Users, Session Frequency, and Average Session Duration. This shifts the focus to levers that encourage repeat visits and deeper interaction, such as the new user retention rate, the click-through rate on content recommendations, and video playback completion rates. In each case, the tree provides a clear, logical model tailored to the specific value the business creates.
The Strategic Advantage: Why This Matters Now
The adoption of Metric Trees signals a maturation of the data industry—a move beyond simply collecting data to actively structuring it for strategic advantage. The first major benefit is universal alignment. When the tree is a shared artifact, an engineer working on page load speed can draw a direct line from their work to the Website Visitors lever, which in turn drives New Customers and the company’s North Star. It creates a common language that dissolves team silos and ensures everyone is pulling in the same direction.
Beyond alignment, a Metric Tree transforms how teams respond to change. It supercharges root cause analysis, turning the frantic search for answers into a methodical investigation. Instead of guessing why a top-line metric moved, you can follow the branches down to the specific lever that changed. This framework also fosters proactive decision-making. Teams can monitor the health of their leading levers—like Trial Sign-up Rate—and intervene before a dip impacts next month’s revenue. It’s no surprise that analytics platforms like Mixpanel are integrating Metric Tree functionality, cementing this framework as a new standard for how modern companies interact with their data.
From Data-Informed to Truly Data-Driven
The difference between a Metric Tree and a KPI dashboard is the difference between a map and a list of cities. A dashboard tells you where you are, but a Metric Tree shows you all the roads that got you there and all the paths you can take to get to your destination.
Building one forces you to understand the fundamental mechanics of your business in a way that staring at a dashboard never will. It transforms data from a passive, historical record into an active, strategic guide for action. It’s the tool that can finally help your organization move from being merely data-informed to becoming truly data-driven.
What’s your company’s North Star Metric? Try mapping out its key drivers on a whiteboard this week. Share your experience in the comments.
For your next project, build a mini-metric tree to define success. It will bring immediate clarity to you and your team.